|
|||||||||||||||||||||||||||||
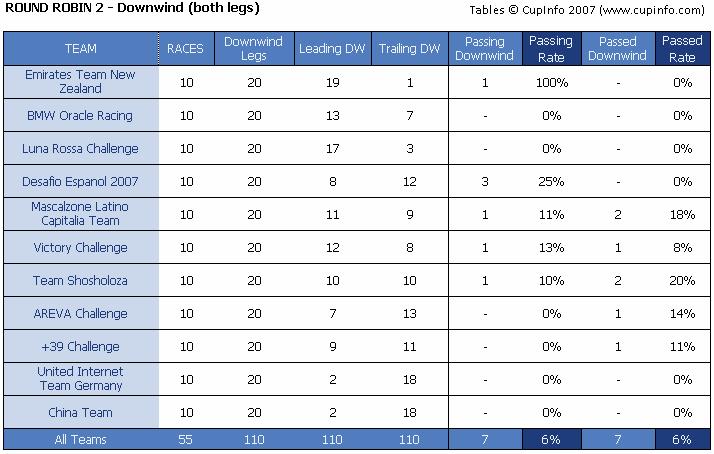
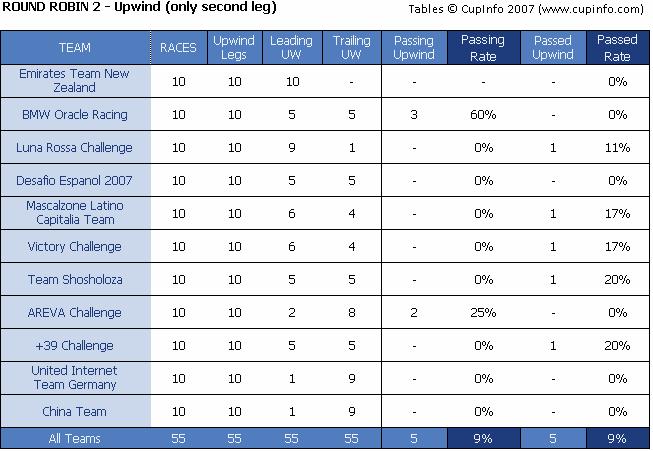
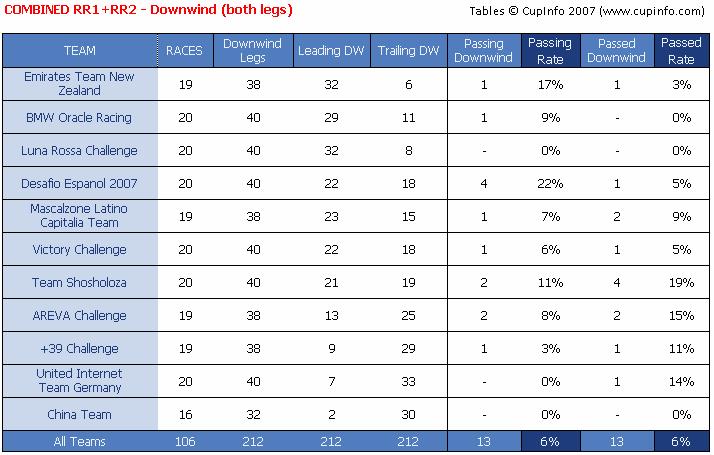
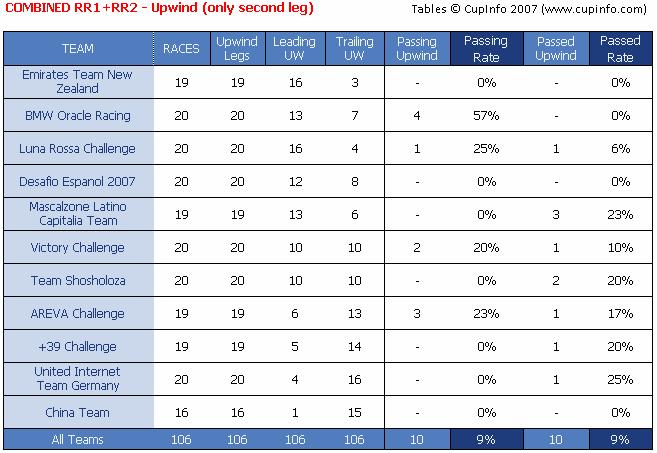
| What is this ? | |||||||||||||||||||||||||||||
| These tables shows how often a team was able to pass (or was actually passed) in the second upwind leg, or in the downwind legs sailed during RR1 and RR2. | |||||||||||||||||||||||||||||
| The first upwind leg of each match was discarded, given difficulty to assess lead at start. | |||||||||||||||||||||||||||||
| 110 matches in sample - 4 matches excluded (DNS or DNF) | |||||||||||||||||||||||||||||
| These tables are Free of use for editorial purposes. Please credit : CupInfo (www.cupinfo.com) | |||||||||||||||||||||||||||||
|
|||||||||||||||||||||||||||||
|
|||||||||||||||||||||||||||||
|
|||||||||||||||||||||||||||||