
CupInfo Home | 2021 America's Cup: Teams | Previous Events | Feature Articles | Books | CupStats
Welcome to CupStats!
2013 America's Cup Match:
Race-by-Race Stats
Tables
2013 Louis Vuitton Cup: Louis
Vuitton Cup Stats
| LVC Results
Previous Event Stats: 2007 America's Cup & Louis Vuitton Cup
On this page (click or scroll down):
ETNZ vs. Oracle Team USA: Race 1 and 2Polars
Speed Over Ground (SOG)
Velocity Made Good (VMG)
Also see: Race 3 and 4 Polars
Polar Plot for Emirates Team New Zealand vs. Oracle Team USA:
SOG: Average Speed-Over-Ground (SOG) at
True-Wind-Angle (TWA)
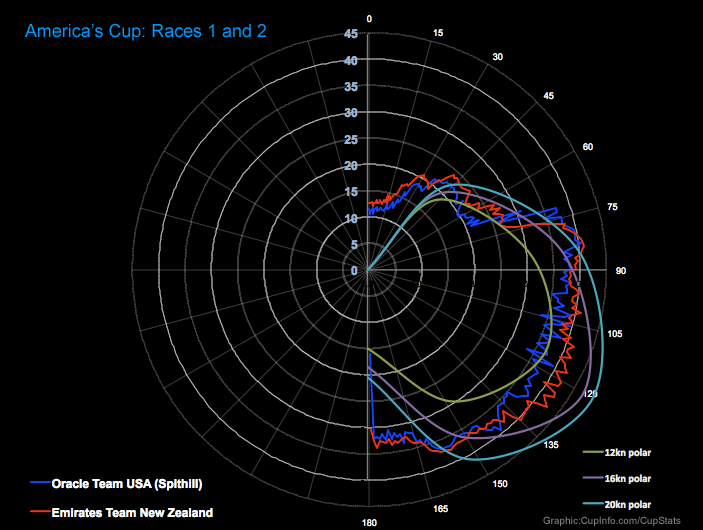
Explanation:
The plot above shows simple average boat speed
at true wind angles based on Races 1 and 2 of the 2013 America's
Cup Final. Boat speed in knots is plotted as distance from the center
(marked in the blue numbers) and true wind angle is plotted as degrees
from the vertical (marked in the white numbers). Zero degrees,
straight up on the plot, is straight into the wind. 180 degrees, straight
down on the plot, is directly downwind.
Oracle is plotted in Blue and Emirates in red. The plots for each boat are over the average wind speeds experienced on the course, which for much of the race were effectively the same.
The green, purple, and turquoise lines are the theoretical polars at wind speeds of 12 kts, 16 kts, and 20kts that the Umpires used to calculate how much a penalized boat must slow down. These penalty polars have been updated since the Louis Vuitton Cup since in some situations the race yachts were regularly exceeding predictions.
Analysis:
The plots of the race yachts are not a true polar showing potential boat
speed, but actual data collected at the angles shown. For
example the speeds at direct downwind angles were recorded during jibes and
the direct upwind angles recorded during tacks. Reaching angles,
close to 90 degrees, would generally be sailed on the first leg of the race
and thus also be influenced by the nature of the competition in that sort
period of time. As such they are a comparison of maneuvering and
other competitive factors between the boats rather than just maximum speed
on any given point of sail.
ETNZ appears to be maintaining speed better though gybes, and especially tacks. Upwind maneuvering appears to be one of the clear places ETNZ built an advantage in Races 1 and 2, eking out small gains each tack, and using that margin as leverage for tactics that forced Oracle USA into a clear behind position, from where the Kiwis could then defend their lead by maintaining cover.
VMG: Velocity Made Good (VMG) at True-Wind-Angle (TWA):
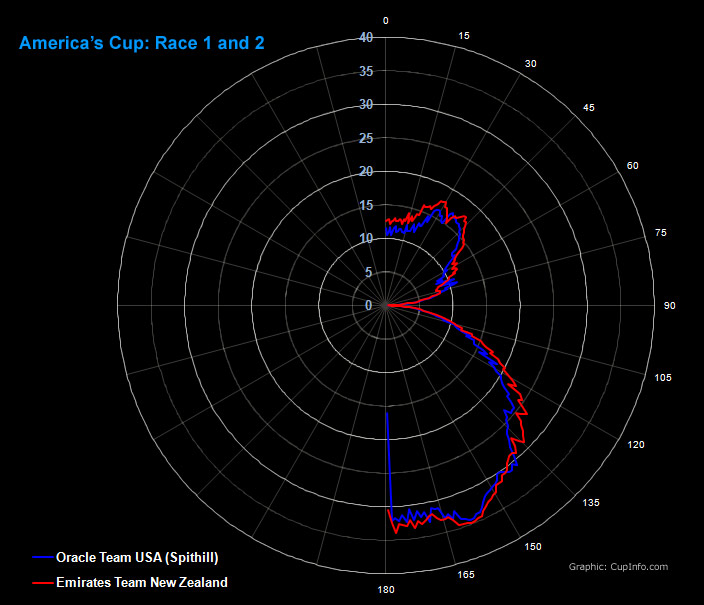
Velocity Made Good (VMG) is calculated in this case as the direct upwind or downwind component of velocity, depending on leg of the race course.
The reaching leg (in the 90 degree range) is obviously not revealing as all speeds approach zero VMG under this definition as they reach exactly 90. The primary areas of interest lie near the most typical upwind angles (in the 40 degree range) and typical downwind angles (near 150 degrees).
ETNZ and Oracle Team USA look extremely tight in the primary downwind angles. Upwind the Kiwis may plot as a faster speed, though some of this may be an effect of being the leading boat and Oracle Team USA taking an extra tack, spending time accelerating back up to speed while ETNZ was already there. Additionally, Oracle had at least one tack where they were down on speed because of ETNZ's cover close ahead and had to tack away prematurely.
Comparing the SOG polar plot to the VMG plot upwind, while the SOG numbers alone favor ETNZ, the more critical VMG is close to even, suggesting that the two teams have made different trade-offs in pointing ability versus pure speed, but are achieving close to the same results.
Rather than locating a clear advantage for one boat over the other, the VMG plot tends to confirm how closely the boats are matched in the conditions observed in the races analyzed.
A key question is how these comparisons might vary with higher or lower wind speeds than those seen so far (17-18 knots).
Inquiries please contact: