
CupInfo Home | 2021 America's Cup: Teams | Previous Events | Feature Articles | Books | CupStats
Welcome to CupStats!
2013 America's Cup Match: CupStats Home
On this page: America's Cup 2013 - ETNZ vs. Oracle Team USA:
True Wing Angle (TWA) Relative Frequency
TWA: True-Wind-Angle
Use scroll bars to move graphs horizontally.
Use scroll bars to move graphs horizontally.
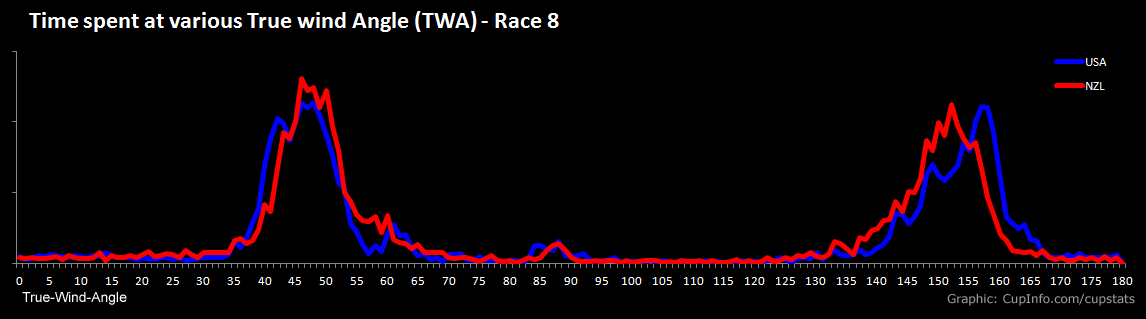
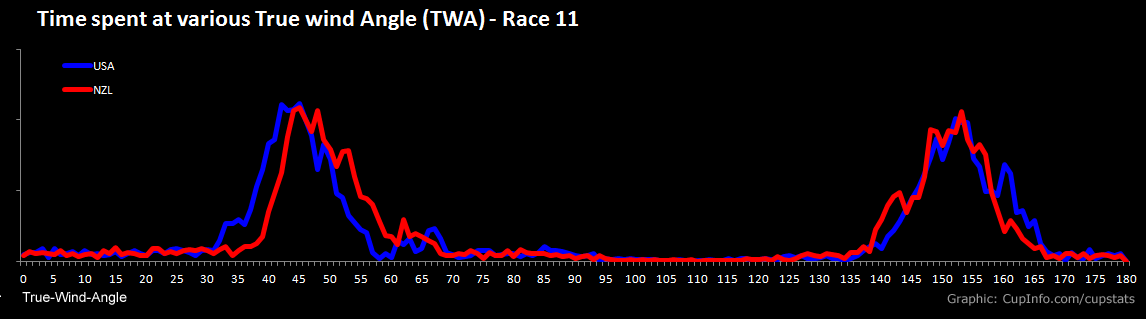
In Race 8, note the significant shift in the curve at the downwind angle, showing Oracle sailing much deep angles. There is a similar though less visually dramatic improvement in the upwind region, with Oracle spending more time at a higher angle.
General Explanation:
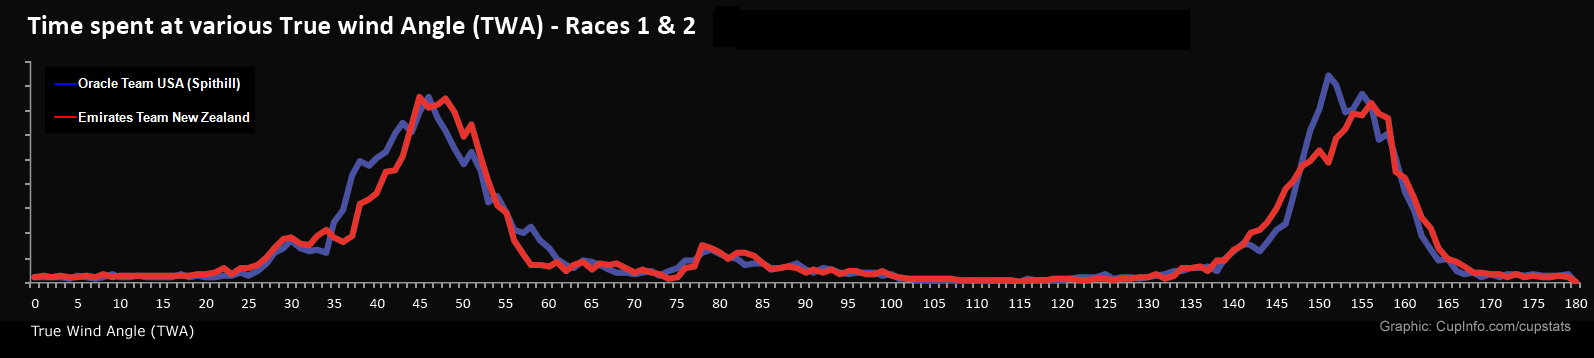
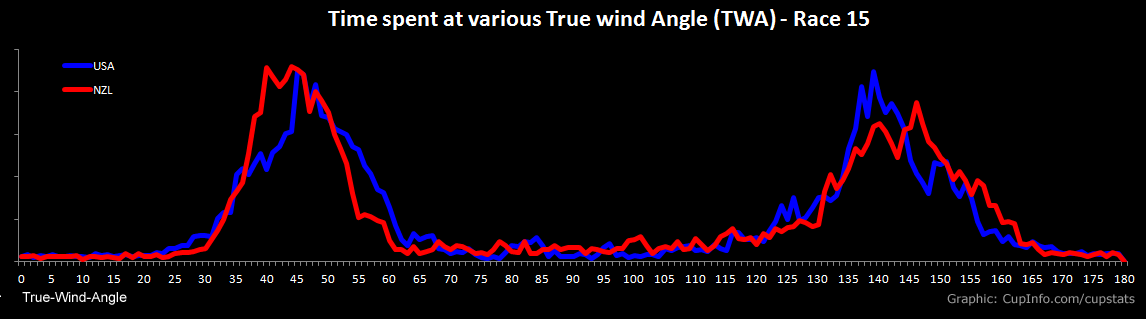
The graph above shows the relative amount of time each team spent at each angle
relative to the actual direction of the wind. Zero degrees is pointing
directly into the wind and 180 degrees is sailing dead downwind, in the
direction the wind is blowing. The red line is Emirates Team New Zealand
and the blue line is Oracle Team USA. The bulk of the upwind time in Races
1 and 2 is between 35 and 55 degrees, and the bulk of the downwind time is
between 145 and 160 degrees. There is a small blip near 80 degrees which
is primarily the reaching leg. Most of the the other angles only occur
during tacks and gybes.
2013 Louis Vuitton Cup: Louis Vuitton Cup Stats | LVC Results
Previous Event Stats: 2007 America's Cup & Louis Vuitton Cup
Inquiries please contact: